What business development KPIs are most important for growth? Well it depends on your stage of growth and industry sector.
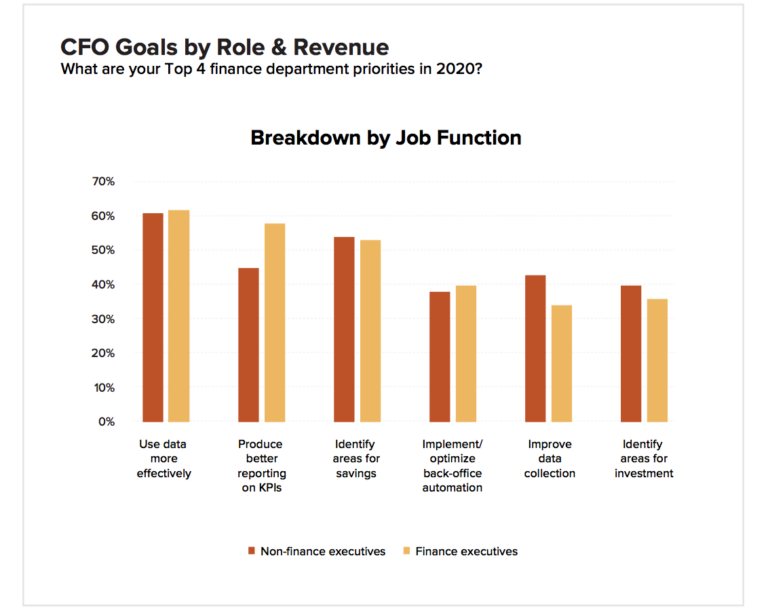
KPIs are an essential piece of financial goal-setting and growth. However, do you know which metrics are essential to your business development and the stage of growth you are in? Even pre-pandemic looking ahead to 2020, NetSuite found that around 60% of finance executives were looking to use data more effectively and report more effectively on KPIs. Plus, if you employ an outsourced CFO they should be able to quickly identify the KPIs that make the most sense for your business development.
Business Development KPIs Examples
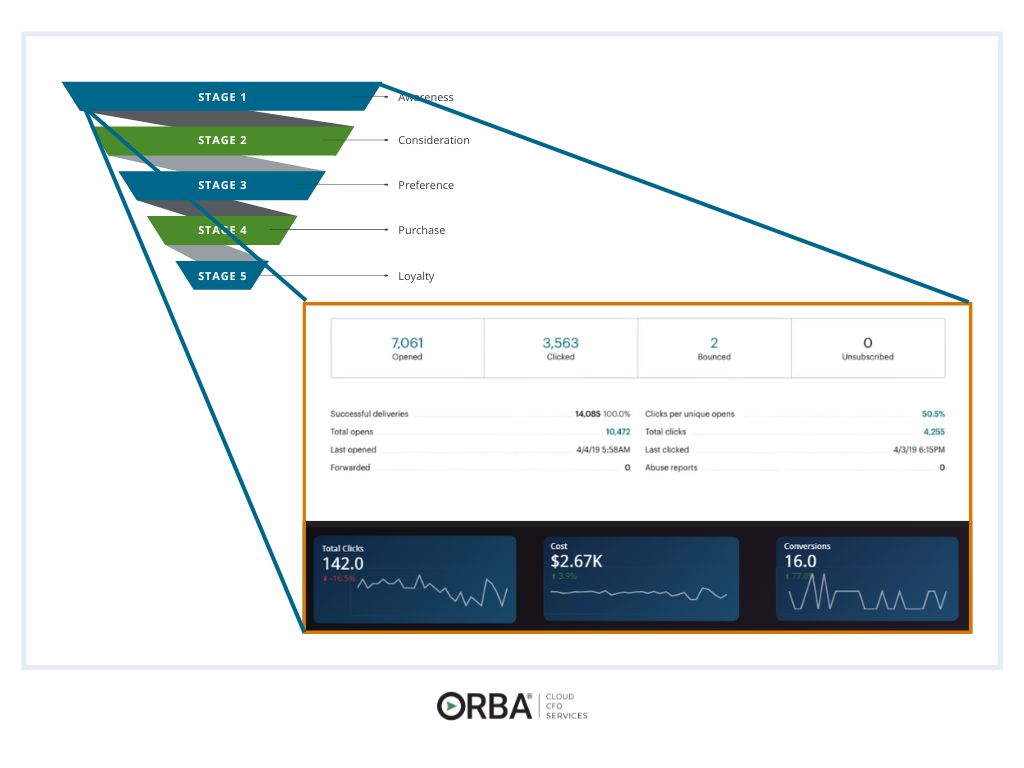
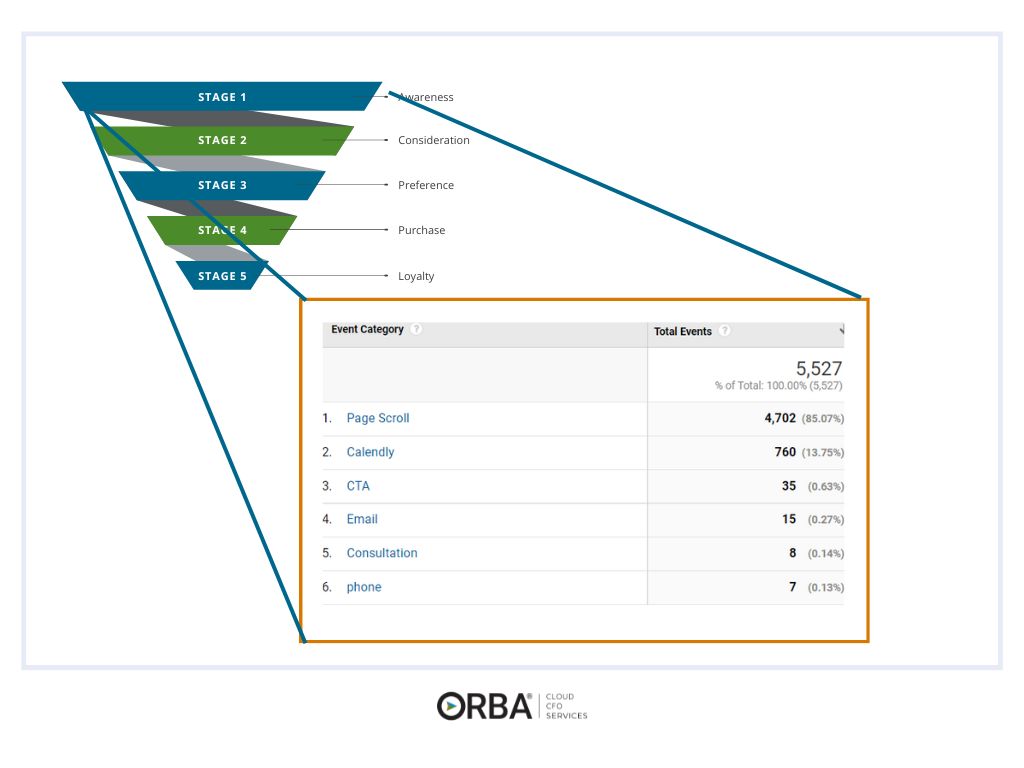
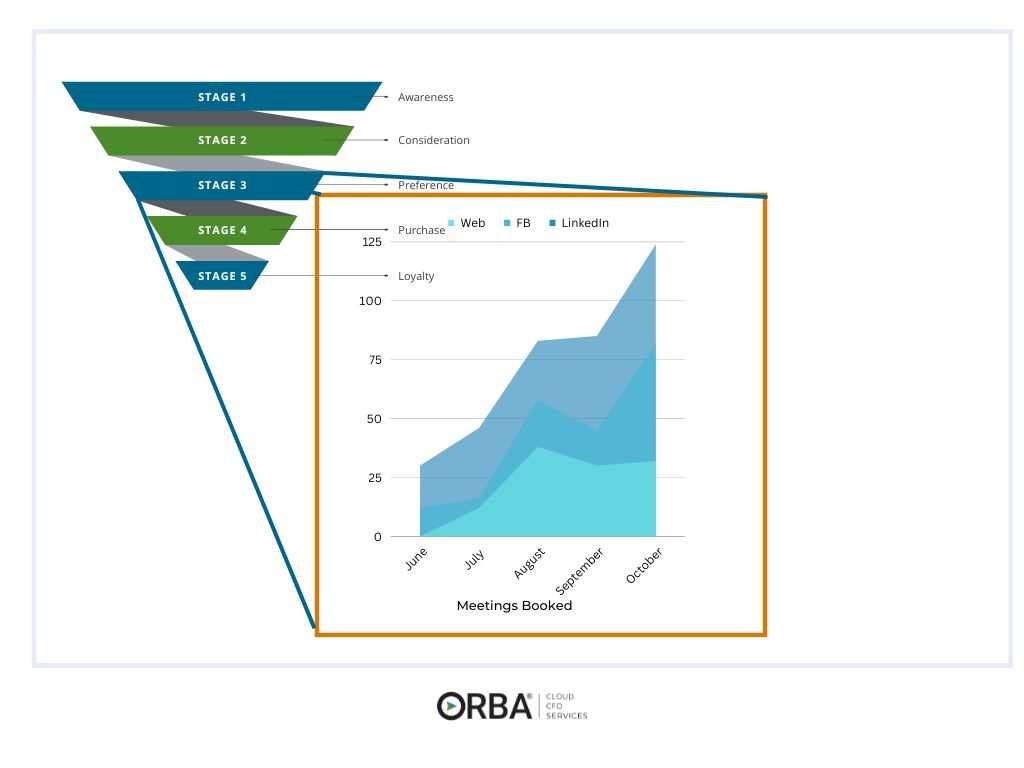
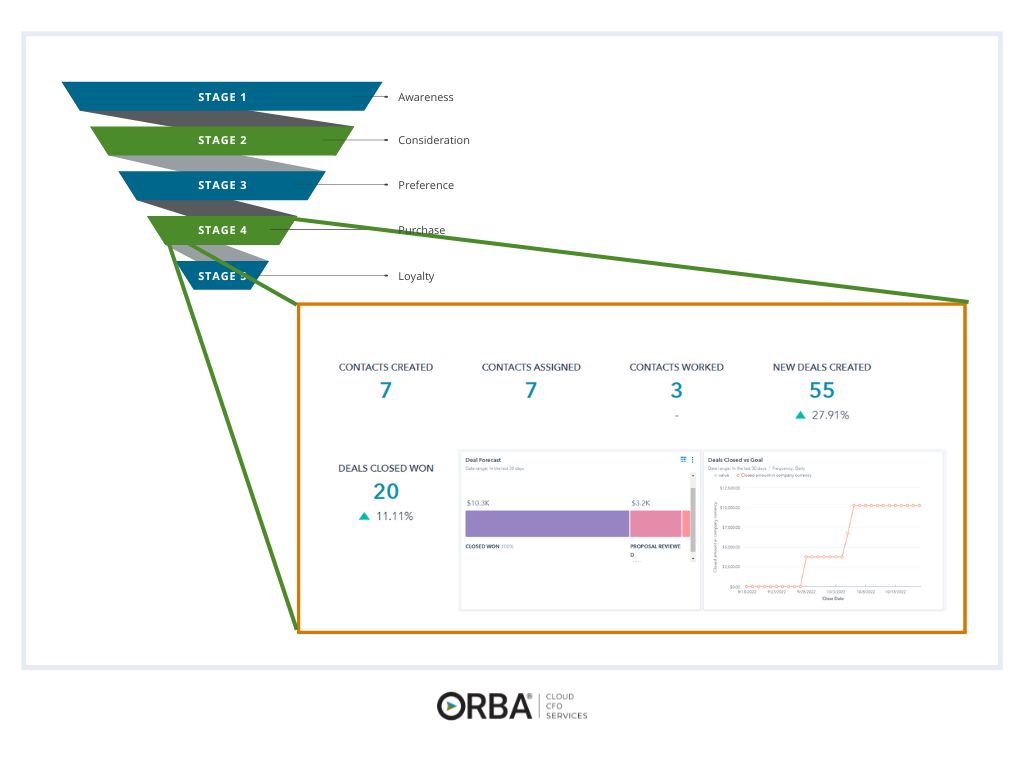
Let’s start by looking at your sales and business development KPIs. While they will differ depending on whether you’re B2B or B2C, your sales funnel will probably look like some version of this:
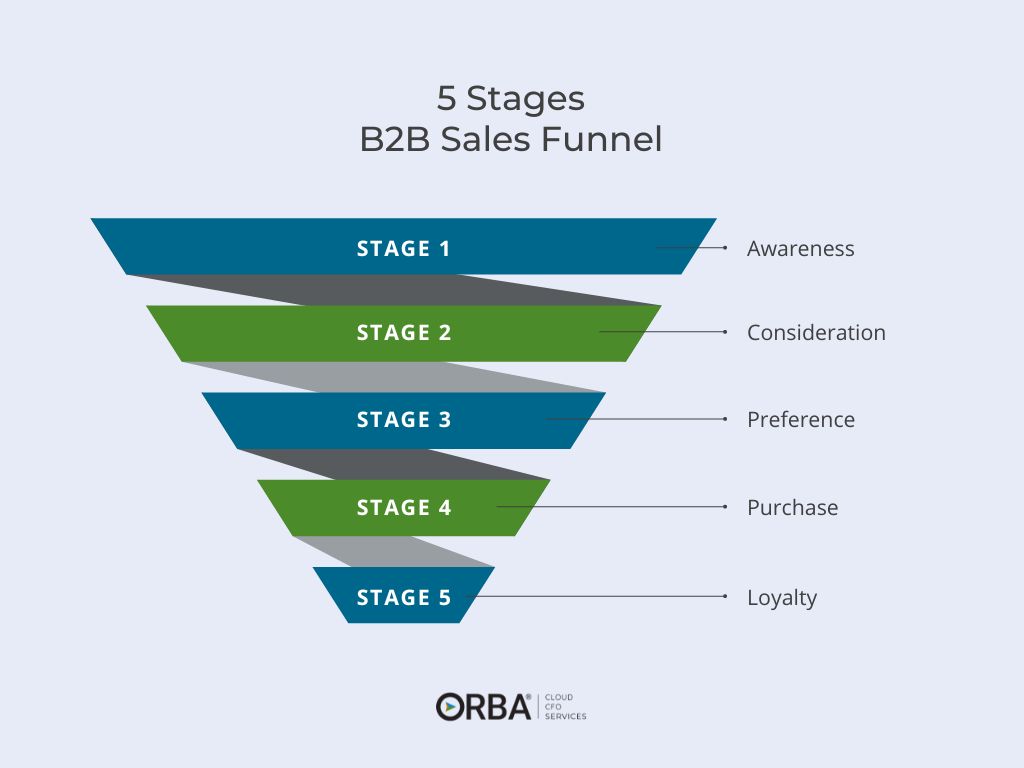
It makes sense to segment your KPIs based on what stage in the funnel the metric occurred. Some of the most important business development KPIs include:
Stage 1: Awareness
- Emails opened and CTR
- Ad clicks and CTR
Stage 2: Consideration
- Phone calls answered
- Gated content downloads
Stage 3: Preference
- New leads
- Intro meetings booked
- Consultations scheduled
- Cost per lead
Stage 4: Purchase
- Conversion rates (segment by funnel stage)
- Proposals sent vs. deals won (Closed-Lost vs. Closed-Won)
- Client acquisition cost
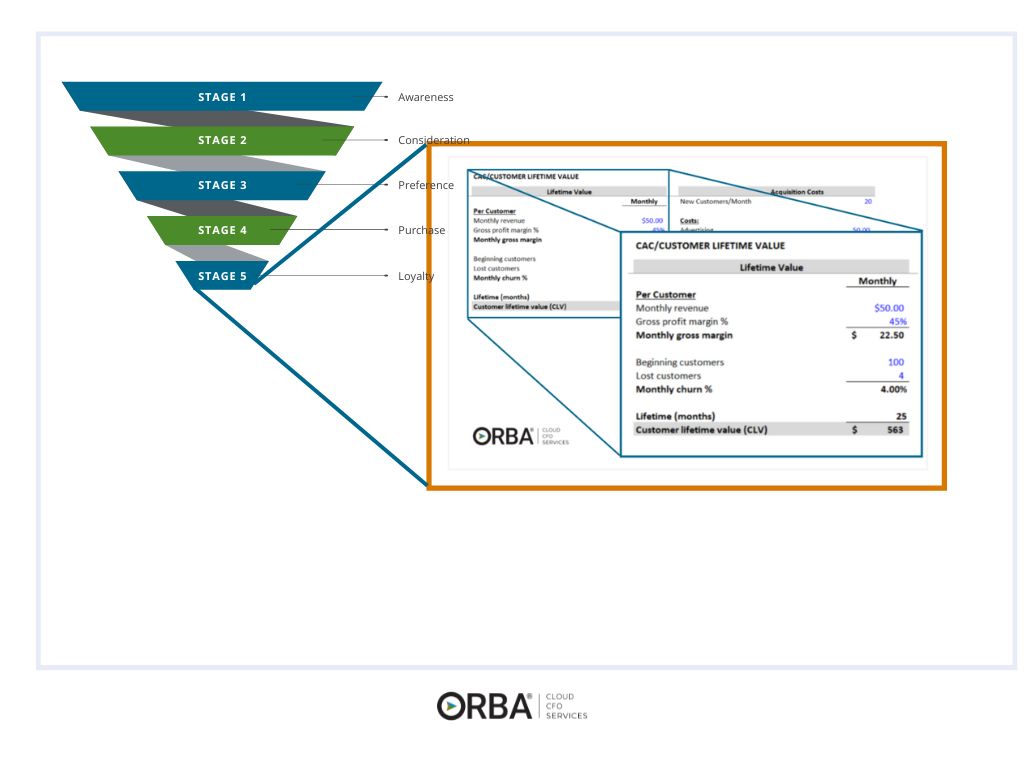
Stage 5: Loyalty KPIs for Business Development
- Customer Churn
- Customer Lifetime Value
- Sales Volume (segment by channel and location)
- Net Promoter Score
Tracking Growth KPIs
Once you’ve moved customers through the sales funnel you will want to continue to track KPIs for growth. While you might hear more about some KPIs or return on investment (ROI), not all are effective measures if you are not at the right stage of growth.
Metrics without context are useless. You don’t need to be drowning in data in order to learn from it. In fact, it’s probably better not to. Focus on the one or two KPIs that are most relevant to scaling your business and you will be a lot more likely to see results. In Lean Analytics by Alistair Croll and Benjamin Yoskovitz, this is referred to as “the One Metric That Matters.”
We are a big fan of Lean Analytics, and if you are a startup, entrepreneur or scaling your business, this book is not to be ignored; however, here is a Cliff Notes quote to help you get the gist:
“…By knowing the business you’re operating in and the stage you’re at you can track & optimize the metric that matters to your business at that stage. This can help overcome risks and avoid premature growth.”
Alistair Croll and Benjamin Yoskovitz
In other words, you want to know what stage of growth you’re in and which growth KPIs are most relevant to you. Additionally, the current market plays an integral role in which KPIs will matter most for your business.
Consider stage of growth and business model when choosing KPIs to track.
For example, NetSuite found that the operating cash flow was the most common KPI that management teams wanted to see updated regularly in the mid-pandemic summer of 2020. Following that, it was the current accounts receivable (found on your balance sheet) and equally, a measure of liquidity: the working capital ratio. Now, not all of these will be your best measure of growth.

Not all KPIs are appropriate for your specific business or stage of growth. A SaaS company, might be tracking its Rule of 40 metrics while you may be tracking cash-on-cash return, IRR and ROI in outsourced real estate accounting.
Related Read: Drive Growth Using our 7-Step Formula for Choosing the Right KPIs
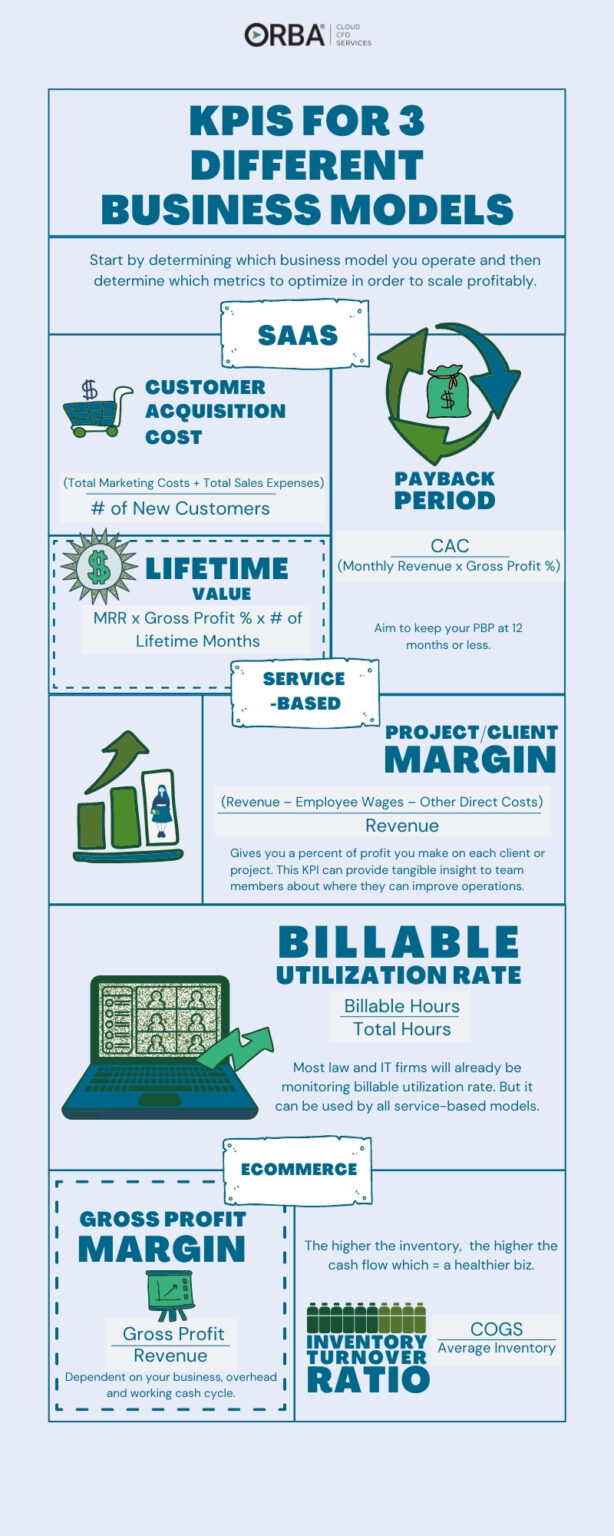
Start by determining which business model you operate and then determine which metrics to optimize in order to scale profitably.
We come across all sorts of models and therefore the analytics we employ with our clients vary greatly. Here are a few of our go-to KPIs for three of the most common business models:
Example KPIs for Business Development
E-Commerce Business Model KPI Example
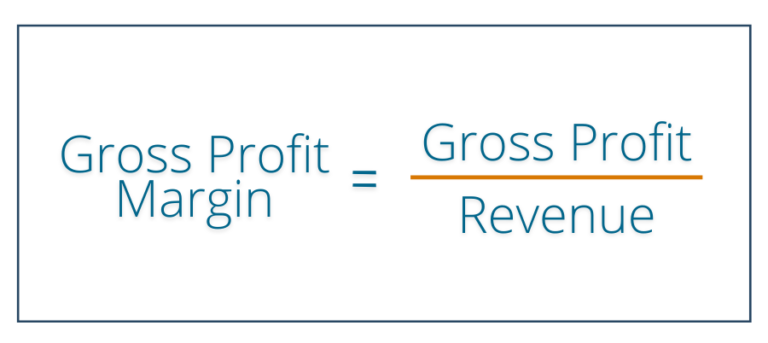
Gross Profit Margin
A question that comes up a lot is whether aiming for a 50% gross profit margin is a good blanket rule. The answer is no, not really. It’s dependent on your business and its overhead costs. Another component that’s often overlooked is the working cash cycle. If you’re offering a product that you’re invoicing for, you may want to have a higher margin to cover late payments. If you’re just starting out selling a physical product, you normally want to markup 300%; however, there are different rules of thumb for different types of models & sales channels.We dig into the working capital cycle more in this post on how to increase cash flow for ecommerce businesses.
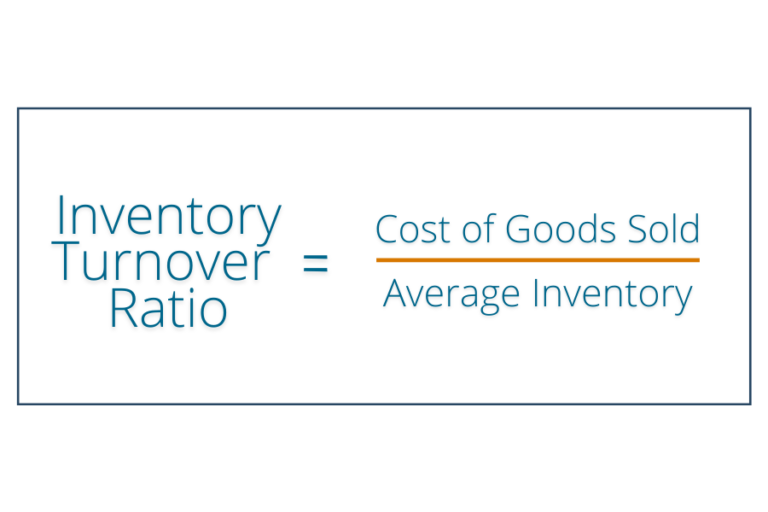
Inventory Turnover Rate
For companies with ecommerce accounting needs, tracking supply chain KPIs is crucial. You want a quick sales cycle so you are not sitting on unsold inventory. The higher the turnover rate, the healthier the company should be, provided you’re hitting the proper margins. This equals better cash flow, which should always be a company’s aim no matter whether you’re growing or sustaining.
Let’s say you moved $10 million in goods over the course of a year and your average inventory on hand clocks in at $800,000.
10,000,000/ 800,000 = 12.5 turns.
Service-Based Business Model KPI Example
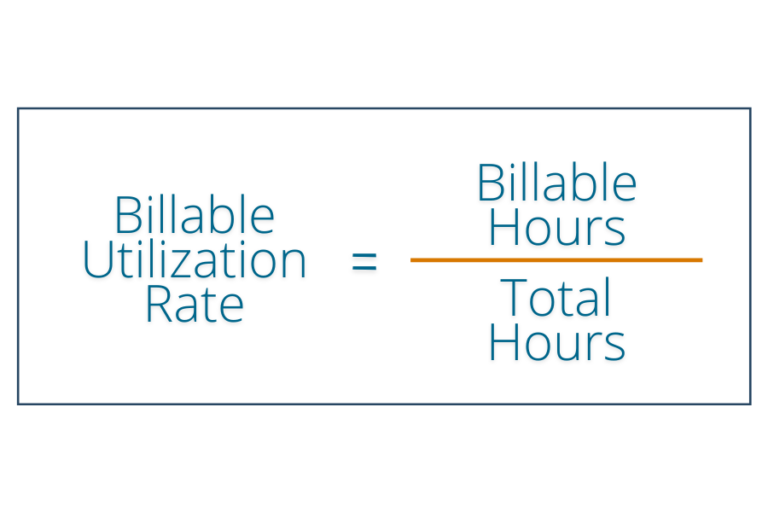
Billable Utilization Rate
Ignoring this metric (especially if you’re in a service-based industry) can be a major growth barrier. (And a money-suck if you’re not careful).
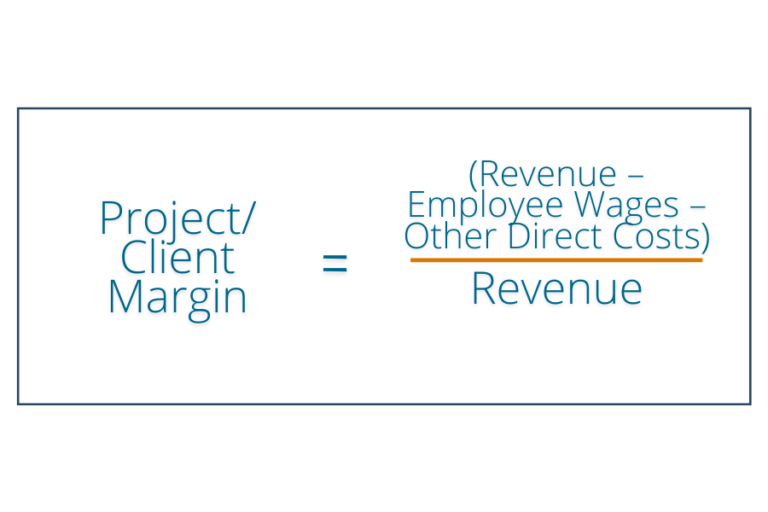
Project or Client Margin
If you are a law firm, IT or other service company you are probably already familiar with Billable Utilization Rate; however, you should also be monitoring all of your Project/Client Margins to really focus on scaling. Similar to the Gross Profit Margin, the Project or Client Margin for a service-based model is the cost of the employee wages and other direct costs divided by revenue. This gives you the percent of profit you make on each client or project from the service provided.
Software as a Service (SaaS) Business Model KPI Example
Lifetime Value/Customer Acquisition Cost Ratio
To break it down a little more, because these particular metrics are not always as obvious in our financials: the Customer Acquisition Cost (CAC) is found from taking your total expenses over a given amount of time, (normally a month) and dividing that by the number of new customers in the same length of time. You will notice that these KPIs would also be relevant to an e-commerce business model, as well. Read more about your allowable CAC and how to lower customer acquisition cost here.
Customer Acquisition Cost (CAC)

Lifetime Value (LTV)
Lifetime Value is your monthly recurring revenue (MRR) multiplied by Gross Profit percent multiplied by the number of lifetime months. It is common to see a Gross Profit of 80% or higher in SaaS models. Read more about our 4 steps to increase customer profitability and lifetime value.
Let’s use Dropbox as an example. Their margin may seem high if they are charging $9.99/month; however, there are some less obvious costs: payment processing, server usage, customer support costs etc.
Finally, take your LTV divided by your CAC and you have got your ratio. Aim for a ratio of 3 or greater to see optimal growth.

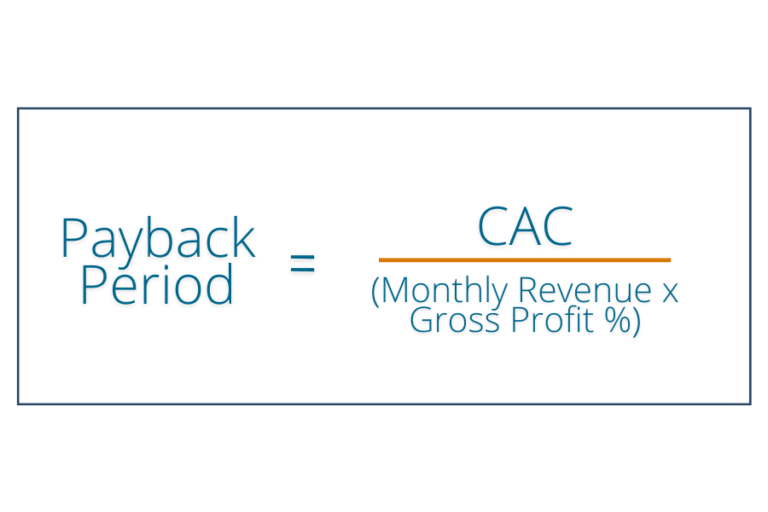
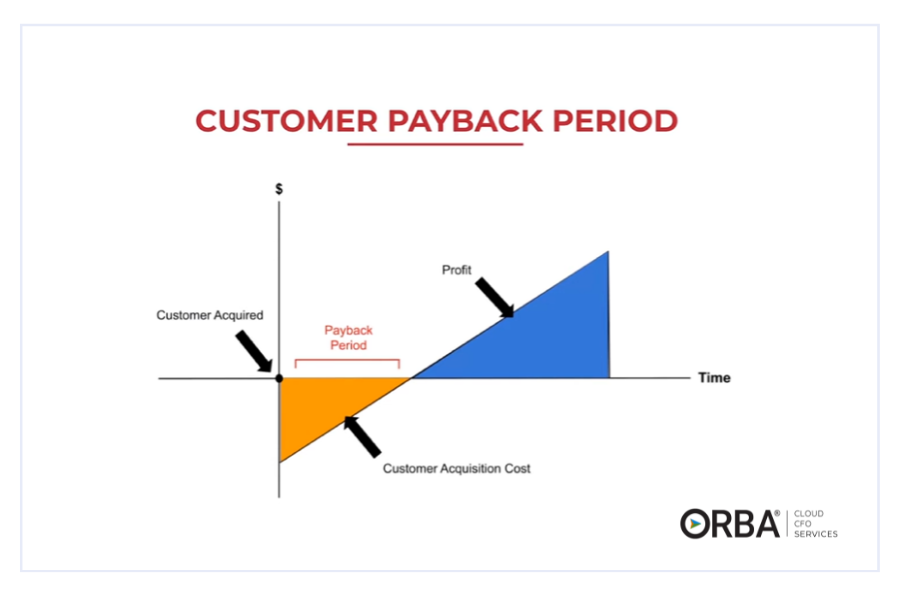
Payback Period (PBP)
It is your cycle of cash and it is our favorite forgotten metric: your Payback Period (PBP). You can dive into more detail on how to calculate your payback period, but it’s similar to inventory turn.
A key takeaway is to keep your PBP at 12 months or less. Meaning if a PBP is 12 months, it took you 12 months to recoup your costs for that customer. Returning back to our Dropbox example: Why do they offer a 20% discount to pay upfront for a year? They have a better PBP if they get the cash immediately versus waiting for 12 months to receive all of your monthly payments.
What you might have noticed, is that even if your business model is not exactly E-Commerce, SaaS or Service, that you can still map a relevant metric to one of the above formulas and tweak that KPI to make it work for your scaling business.
Related Read: An additional measure of financial health that a SaaS company can review is whether they meet the Rule of 40.
The Bottom Line:
If you don’t yet have a plan for collecting data and calculating KPIs, make one. Be prepared to revisit the plan regularly. At least twice a year it’s important to ask yourself which KPIs are most used, and which aren’t turning out to be all that useful. Begin with your business development KPIs and then work towards identifying your company’s most relevant growth KPIs or growth drivers. Here is a useful infographic depicting the best KPIs and their formulas for the SaaS, Services and eCommerce Business models:
Once you understand which KPIs for growth are best for your business and the stage of growth you are in, you can strategize around them. Where are you missing insights, and how can you get them? Do that and you won’t just talk the “growth” talk, but you’ll be walking the “growth” walk.
Ready to grow? Maybe it’s time for you to hire an outsourced CFO. Learn more or contact us to book your free consultation.
